
Within the concept of execution loops, let’s see how to apply a prescribed PWM duty cycle. The ideas presented here are applicable to an analog output (voltage) as well, if your DAQ device supports it. These examples use a Raspberry Pi with an LED and a series resistor of 300 to 1000 Ohm, as shown in this GPIO Zero recipe setup. They also use the plotting function plot_line defined in previous posts.
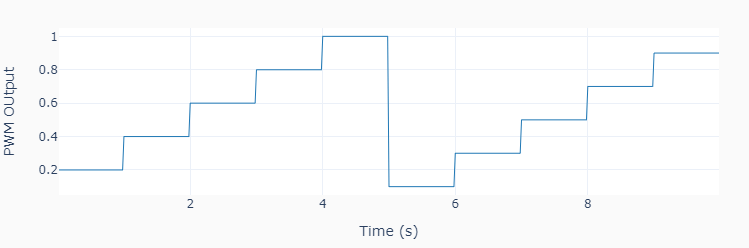
The first code example shows how to apply a pre-defined sequence of steps pwmvalue at regular time intervals tstep.
import time
import numpy as np
from utils import plot_line
from gpiozero import PWMOutputDevice

# Assigning parameter values
pinled = 17  # PWM output (LED input) pin
pwmfreq = 200  # PWM frequency (Hz)
pwmvalue = [0.4, 0.6, 0.8, 1.0, 0.1, 0.3, 0.5, 0.7, 0.9]
tstep = 1.0  # Interval between step changes (s)
tsample = 0.02  # Sampling period for code execution (s)
tstop = tstep * (len(pwmvalue)+1)  # Total execution time (s)
# Preallocating output arrays for plotting
t = []  # Time (s)
value = []  # PWM output duty cycle value

# Creating PWM output object (LED input)
led = PWMOutputDevice(pinled, frequency=pwmfreq)
# initializing other variables used in the loop
count = 0
valuecurr = 0.2

# Initializing timers and starting main clock
tprev = 0
tcurr = 0
tstart = time.perf_counter()
# Running execution loop
print('Running code for', tstop, 'seconds ...')
while tcurr <= tstop:
    # Updating PWM output every `tstep` seconds
    # with values from prescribed sequence
    if (np.floor(tcurr/tstep) - np.floor(tprev/tstep)) == 1:
        valuecurr = pwmvalue[count]
        led.value = valuecurr
        count += 1
    # Acquiring digital data every `tsample` seconds
    # and appending values to output arrays
    if (np.floor(tcurr/tsample) - np.floor(tprev/tsample)) == 1:
        t.append(tcurr)
        value.append(valuecurr)
# Updating previous time and getting new current time (s)
tprev = tcurr
tcurr = time.perf_counter() - tstart

# Releasing pins
led.close()
print('Done.')

# Plotting results
plot_line([t], [value], yname='PWM OUtput')
plot_line([t[1::]], [1000*np.diff(t)], yname='Sampling Period (ms)')

The second example shows how to apply a pre-defined sequence of ramps where each segment has a duration rampduration and final value rampvalue.
To run this example, the SciPy package needs to be installed on the Raspberry Pi (pi@raspberrypi:~$ sudo apt install scipy). You will need to fix a conflict between the numpy packages used by SciPy and Raspberry Pi, by installing this library: pi@raspberrypi:~$ sudo apt-get install libatlas-base-dev .
import time
import numpy as np
from utils import plot_line
from scipy.interpolate import interp1d
from gpiozero import PWMOutputDevice

# Assigning parameter values
pinled = 17  # PWM output (LED input) pin
pwmfreq = 200  # PWM frequency (Hz)
rampduration = [0, 0.5, 1.5, 0.5, 1.5, 0.5, 1.5, 0.5, 1.5, 0.5, 1.5]
rampvalue = [0, 0.2, 0.0, 0.4, 0.0, 0.6, 0.0, 0.8, 0.0, 1.0, 0.0]
tsample = 0.02  # Sampling period data sampling (s)
tstop = np.sum(rampduration)  # Total execution time (s)
# Preallocating output arrays for plotting
t = []  # Time (s)
value = []  # PWM output duty cycle value

# Creating interpolation function for ramp sequence
tramp = np.cumsum(rampduration)
framp = interp1d(tramp, rampvalue)
# Creating PWM output object (LED input)
led = PWMOutputDevice(pinled, frequency=pwmfreq)

# Initializing timers and starting main clock
tprev = 0
tcurr = 0
tstart = time.perf_counter()
# Running execution loop
print('Running code for', tstop, 'seconds ...')
while tcurr <= tstop:
    # Updating PWM output every loop step with
    # interpolated ramp values at the current time
    valuecurr = framp(tcurr)
    led.value = valuecurr
    # Acquiring digital data every `tsample` seconds
    # and appending values to output arrays
    if (np.floor(tcurr/tsample) - np.floor(tprev/tsample)) == 1:
        t.append(tcurr)
        value.append(valuecurr)
    # Updating previous time and getting new current time (s)
    tprev = tcurr
    tcurr = time.perf_counter() - tstart

# Releasing pins
led.close()
print('Done.')

# Plotting results
plot_line([t], [value], yname='PWM OUtput')
plot_line([t[1::]], [1000*np.diff(t)], yname='Sampling Period (ms)')
By choosing the proper values for rampduration and rampvalue, virtually any trace composed of linear segments can be generated.
rampduration = [0, 0.5, 1.0, 1.0, 1.5, 0.5, 0.5, 0.5, 1.5, 0.5, 1.5, 1.0]
rampvalue = [0, 0.2, 0.2, 0.4, 0.4, 0.2, 0.2, 1.0, 1.0, 0.6, 0.4, 0.4]

And since the current time is used for the interpolation of the trace current value, a very accurate signal can be generated, regardless of fluctuations in the duration of the execution steps.
If you liked the featured image at the top of the post, feel free to get the Python source code on my GitHub page.
