
Picking it up from where we stopped in the previous post, let’s see how we can determine the effective moment of inertia![]() , the effective damping
, the effective damping ![]() and the torque constant
and the torque constant ![]() for the reduced order model shown in the diagram.
for the reduced order model shown in the diagram.

Before we start, it’s a good idea to revisit a typical set of torque/speed curves for a DC motor. They will come in handy to better understand the parameter determination (identification) tests that are explained further down the post.
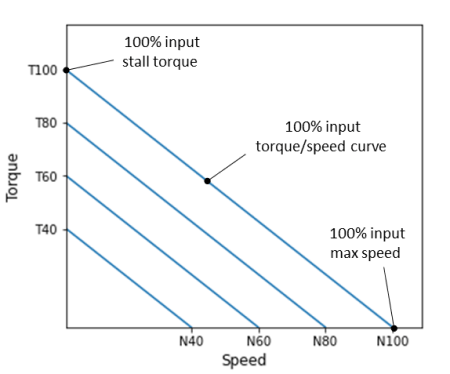
The graph shows torque/speed curves at constant input voltages for a DC motor, for arbitrarily chosen levels of 40, 60, 80 and 100%.
The torque values on the zero-speed y-axis represent the motor stall torque at different input voltages. Conversely, the speed values on the zero-torque x-axis represent the unloaded maximum motor speed, also at different input voltages.
These two special sets of data points will be used to determine![]() and
and![]() respectively.
respectively.
This time around, I’ll use a LEGO Mindstorms EV3 large motor. The basic reason behind such hardware choice is the easiness to build different test fixtures based on the parameter that’s being identified.
Determination of DC Motor Torque Constant
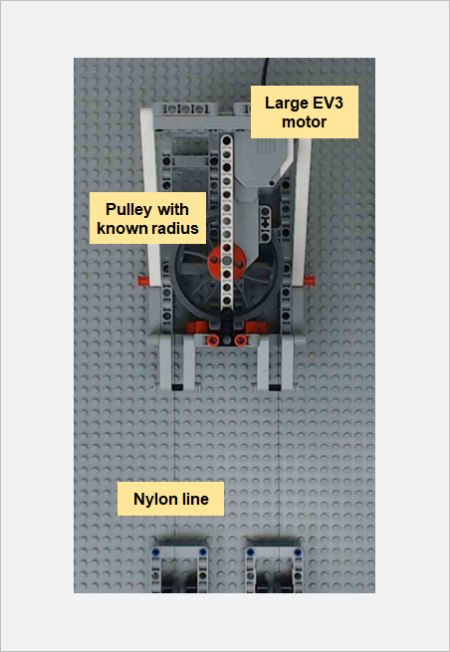
The torque constant![]() can be determined through a series of torque stall tests with varying motor input levels. The images below show the LEGO fixture that was built to accomplish the task.
can be determined through a series of torque stall tests with varying motor input levels. The images below show the LEGO fixture that was built to accomplish the task.


The fixture design allows for the motor angular motion to be converted to a linear motion through the pulley system and the Nylon line. Therefore, the torque can be calculated from the measured linear force using the spring gauge.
Since the radius of the large pulley is known, the measured force in N can be converted to a measured torque in N.m.
The low budget gauge accuracy was verified with known masses and proved to be meet the standards of this blog. As a side note, calibration/verification of your measurement gauges should always be a part of any experimental testing!
Because of the nature of the force gauge, where the measurement readings had to be done visually by myself, it wasn’t possible to automate this test. Nonetheless, I used the pyev3 package to create a motor object and interactively set output levels.
It should be noted that the motor input can range between -100 and 100 %. The values are likely PWM duty cycle and seem to have a linear relationship with armature voltage (to which I don’t have access through the EV3 brick).
Finally, the mass of the spring gauge was taking into account when calculating the torque values.

The stall torque was measured for 4 large EV3 motors, where each point on the plot is the average of three torque values calculated from the corresponding force reading.
Four input levels were used, i.e., 40, 60, 80, and 100%. The dashed lines were fitted to the data points for each motor. Now, if we remember from the first test of the previous post that:

Then the slope of each line represents the torque constant in N.m/%. The average value is:

Determination of DC Motor Damping
Similarly to the torque constant determination, four large EV3 motors were used to generate the damping data. This time around however, because no torque load is applied to the motors, no fixture was required for the testing other than my hand holding the motor.

The plot shows the results for the zero-load tests, where each point is the average of three measurements for a given motor. The same input levels of the previous section were used.
If we reference back to the second test of the DC Motor Characterization (1 of 2) post, where:

The slope of the fitted dashed lines represents the speed constant in rad/s/%. The average value is:

Since we already know the value of the torque constant![]() , the damping constant can then be calculated, leading to:
, the damping constant can then be calculated, leading to:

The Python code used to generate the plots and data fits above, as well as the automated test for the determination of the motor speed constant, can be found here.
Determination of DC Motor Inertia
The final parameter to be identified is the effective moment of inertia. As the name suggests, it accounts for the rotor inertia and any rotating masses attached to the output shaft. In the particular case of the EV3 motor, there’s a gearbox between the rotor and the output shaft. Therefore the moment of inertia of all the gears and the effect of the gear ratios will be accounted for, once we determine the effective moment of inertia![]() reduced to the output shaft.
reduced to the output shaft.
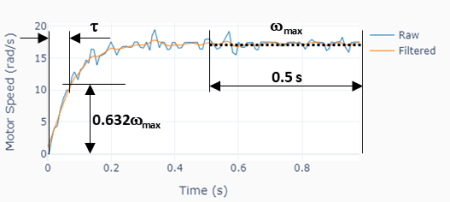
The moment of inertia will be estimated using the third test from the previous post as illustrated on the plot to the left. The idea is to determine the time constant![]() of the approximated first order system and use
of the approximated first order system and use

to determine ![]() since
since ![]() is already known.
is already known.![]() is the time to reach 63.2% of the steady-state speed value
is the time to reach 63.2% of the steady-state speed value![]() .
.
Some signal processing was used, as suggested in the graph above. A zero-shift low-pass filter was applied to the motor angular speed signal and then![]() was calculated as the median value of the last 0.5 seconds of the signal. With the steady-state speed value in hands,
was calculated as the median value of the last 0.5 seconds of the signal. With the steady-state speed value in hands, ![]() can be easily determined and therefore
can be easily determined and therefore ![]() .
.
Four different motors were tested at four input levels (40, 60, 80, and 100%), where five measurements were taken at each level. With a median time constant![]() of 0.076 s, and using the the formula above with the already determined
of 0.076 s, and using the the formula above with the already determined ![]() , The effective moment of inertia at the motor shaft output is:
, The effective moment of inertia at the motor shaft output is:

Note that the effective moment of inertia is a fairly large number for such a small motor. Remember however that the moment of inertia at the shaft output is proportional to the squared value of the gear ratio. Which means, for our particular LEGO motor, if the gear ratio is for example 1:30, the rotor moment of inertia is 900 times smaller that the value at the gearbox output!
More on Effective Moment of Inertia
Let’s explore what happens if we attach an additional rotating mass to the shaft output, thus modifying the effective moment of inertia. One would expect the response time constant to increase as the rotating inertia increases.
To that end, the original test fixture was modified to accommodate two balanced counter weights. Such setup creates a zero load torque while allowing for different load inertias (by changing the mass of the counter weights).

Just for the sake of this exercise, let’s call the original effective moment of inertia of the LEGO large motor at the output shaft as![]() and the additional inertia due to the counter-weights as
and the additional inertia due to the counter-weights as ![]() . Note that
. Note that

where![]() is the total mass of the counter-weights and
is the total mass of the counter-weights and![]() is the radius of the pulley. The moment of inertia of the pulley is negligible when compared to that of the counter-weights.
is the radius of the pulley. The moment of inertia of the pulley is negligible when compared to that of the counter-weights.
Two sets of weights were used, i.e., 0.149 and 0.249 kg with a corresponding moment of inertia ![]() of 0.00023 and 0.00045 kg.m2 (the pulley radius is 39.25 mm). Using the formula below with all the known quantities allows us to calculate the time constant of the system with motor plus counter-weights.
of 0.00023 and 0.00045 kg.m2 (the pulley radius is 39.25 mm). Using the formula below with all the known quantities allows us to calculate the time constant of the system with motor plus counter-weights.

In our case, the calculated values of![]() are 0.086 and 0.098 s. Running the test shown on the left, with four different motors and four different output levels, in fact produced measured
are 0.086 and 0.098 s. Running the test shown on the left, with four different motors and four different output levels, in fact produced measured ![]() values within +/- 3% of the corresponding calculated ones!
values within +/- 3% of the corresponding calculated ones!
DC Motor Model Confirmation
It’s always a good idea to check whether the motor characterization parameters can be used to build a model that represents the actual system behavior. To do that, a set of counter-weight masses that haven’t been tested during the characterization was chosen, resulting in the following motor model.
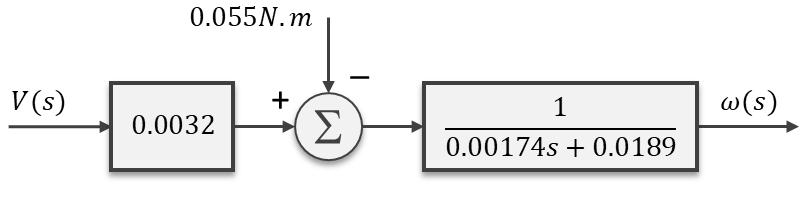

Where the load torque due to the uneven counter-weight masses is 0.055 N.m and the effective inertia is 0.0014 + 0.00034 = 0.00174 kg.m2. The plot on the left shows good agreement between the actual LEGO fixture test results and the Simulink simulation of the reduced-order model above, for a 70% duty-cycle step input.
